Introduction
A common assumption among SME leadership is that real-time Supply Chain KPI dashboard for visibility requires a full ERP rollout first. That assumption delays dashboards for years, and in the meantime, decisions keep getting made on gut feel and month-end spreadsheets that are already stale by the time anyone reads them.
The reality is that a focused set of supply chain KPI dashboard can be built and running within weeks using existing data sources, purchase records, inventory counts, delivery logs long before a full ERP implementation is feasible or affordable. The dashboard doesn’t need to be perfect. It needs to be trusted and current.
Table of Contents
Why SMEs Default to Waiting for ERP
The logic seems sound on the surface: an ERP will eventually centralize all the data anyway, so why build reporting infrastructure twice? In practice, this reasoning costs SMEs one to three years of blind decision-making while the ERP project gets scoped, budgeted, and implemented and ERP implementations for SMEs routinely take longer and cost more than initially planned. Planning an ERP rollout? Read the common SAP MM Implementation pitfalls first.
McKinsey’s research on digital supply chains points out that the organizations getting the most value from digitalization are the ones that build incremental visibility early and layer more sophisticated systems on top of it, rather than waiting for a single large transformation to deliver everything at once.
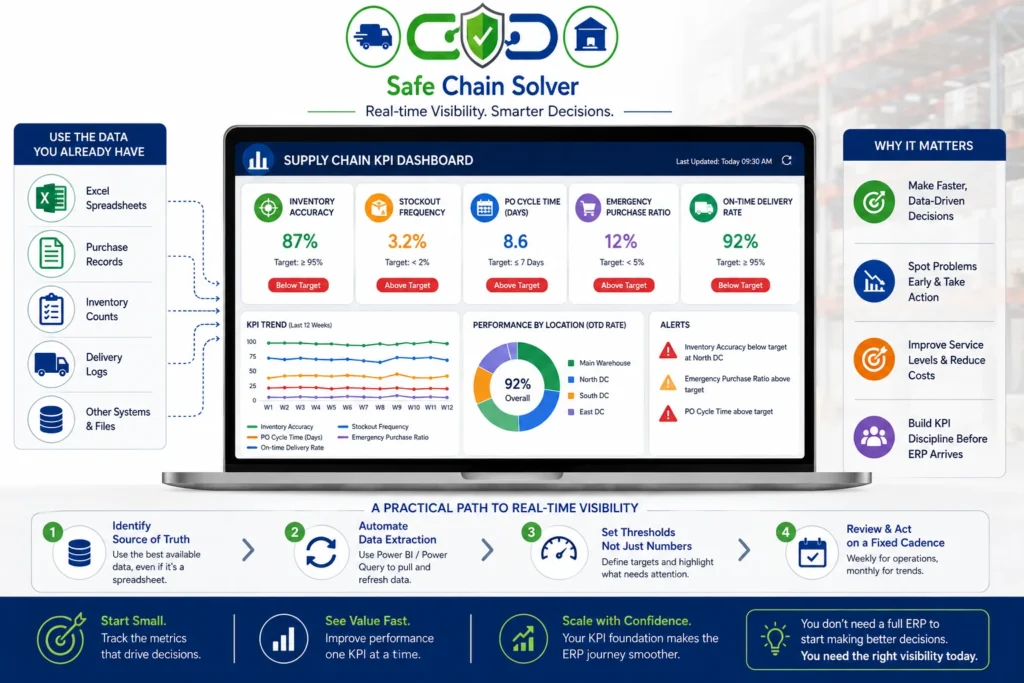
The KPIs Worth Building First
Not every metric deserves a dashboard slot. For most SMEs, a small, well-chosen set delivers most of the decision-making value:
– Inventory accuracy, the percentage match between recorded and physical stock, ideally tracked per location rather than as one blended figure
– Stockout frequency, how often demand couldn’t be met from available stock, which surfaces safety stock and reorder problems faster than any other single metric
– Purchase order cycle time, the days from requisition to goods receipt, which exposes procurement bottlenecks that are otherwise invisible until a customer complains
– Emergency purchase ratio, the share of purchases made outside normal planning cycles, a leading indicator of planning and forecasting weaknesses
– On-time delivery rate, whether outbound commitments are being met, tracked against the original promise date, not the revised one
This set overlaps deliberately with the metrics behind ABC analysis and EOQ-driven reorder decisions, because a Supply Chain KPI dashboard is only useful when it’s built around decisions your team is already trying to make, not metrics that look impressive in a boardroom slide.
Building Supply Chain KPI Dashboard: A Practical Path
** Step 1: Identify the source of truth for each metric, even if that source is a well-maintained spreadsheet or a warehouse management module rather than a full ERP. Consistency matters more than sophistication at this stage.
** Step 2: Automate the extraction, not the analysis. Tools like Power BI or Excel with Power Query can pull from multiple spreadsheets or basic databases on a scheduled refresh, removing the manual copy-paste step that makes most SME reporting stale within days of being built.
** Step 3: Set thresholds, not just numbers. A supply chain KPI dashboard showing “inventory accuracy: 87%” is less useful than one that flags 87% in red against a defined 95% target, because it tells the viewer whether action is needed without requiring interpretation.
** Step 4: Review the supply chain KPI dashboard on a fixed cadence, weekly for operational metrics, monthly for trend review and assign someone to act on what it shows. A dashboard nobody is accountable for reviewing decays into background noise within a quarter.
What Changes When the ERP Eventually Arrives
Building KPI discipline before a full ERP implementation isn’t wasted effort, it’s preparation. According to CSCMP, organizations with mature supply chain metrics practices integrate new systems faster because the KPI definitions, thresholds, and reporting cadence are already established; the ERP simply becomes a cleaner data source feeding the same dashboard structure, rather than a project that has to invent KPI logic from scratch under implementation pressure.
How Safe Chain Solver Can Help
Safe Chain Solver builds AI-assisted supply chain KPI dashboard and operational reporting for SMEs that need real-time visibility now, not after a multi-year ERP rollout, including:
– KPI selection and threshold design tied to actual operational decisions
– Power BI dashboard builds that pull from existing spreadsheets and systems
– Reporting cadences and accountability structures that keep dashboards in active use
– A migration path so dashboard logic transfers cleanly if and when a full ERP is implemented
This work is part of our broader Digitalization & Automation services, and pairs naturally with our Free SC Tools for teams that want to start tracking key metrics immediately.
Conclusion
Waiting for a full ERP before building KPI visibility trades years of informed decision-making for a theoretically cleaner future data source. A focused supply chain KPI dashboard built on existing data, reviewed on a fixed cadence and tied to real decisions, delivers most of the value immediately and makes the eventual ERP rollout smoother, not redundant.